In this post, we are continuing the Getting Started with Visual QMS series with one of the foundations of a Visual Quality Management System: the Visual Process Map. I makes sense, doesn’t it? You need something visual to connect the other components of the system to, in order for it to be a visual Quality Management System. In the sections below we will touch upon making a well-made and easily understood process map which can quickly deliver all the knowledge your staff needs to succeed and stay compliant.
Getting started with Process Mapping
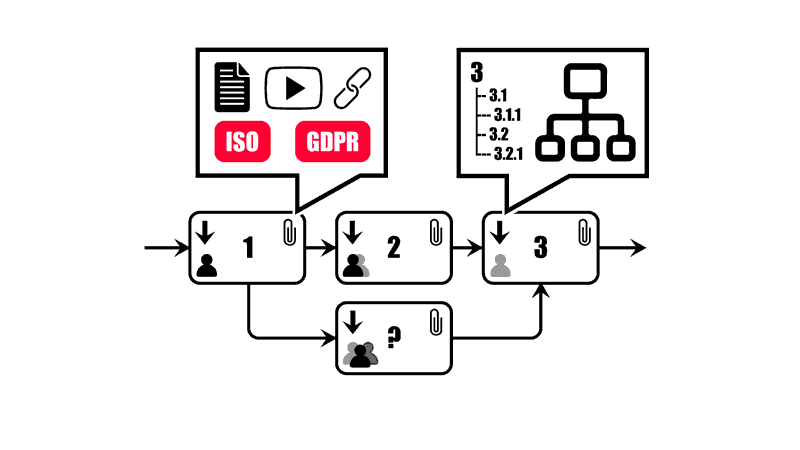
When you make a map of your company processes, it is important that it is easily understood by the intended users. Otherwise it all goes down the drain. While there are many ways to map processes, we recommend using UPN (Universal Process Notation) for your Visual QMS. It is an intentionally simple notation language, where the map has several layers to ensure each screen is easy-to-understand and has room for links and other useful attachments on the boxes. You can read more about it in this PDF containing the latest version of UPN.
Starting at the top level of responsibility and progressing down from there, we put the Process Owners and their people to work at mapping the company process areas as-is. Mapping is typically done in workshops, where the project organization learn more about UPN and how to use the easy web tool as different leveles of the business processes are captured.
Level 1: The Company Top Level
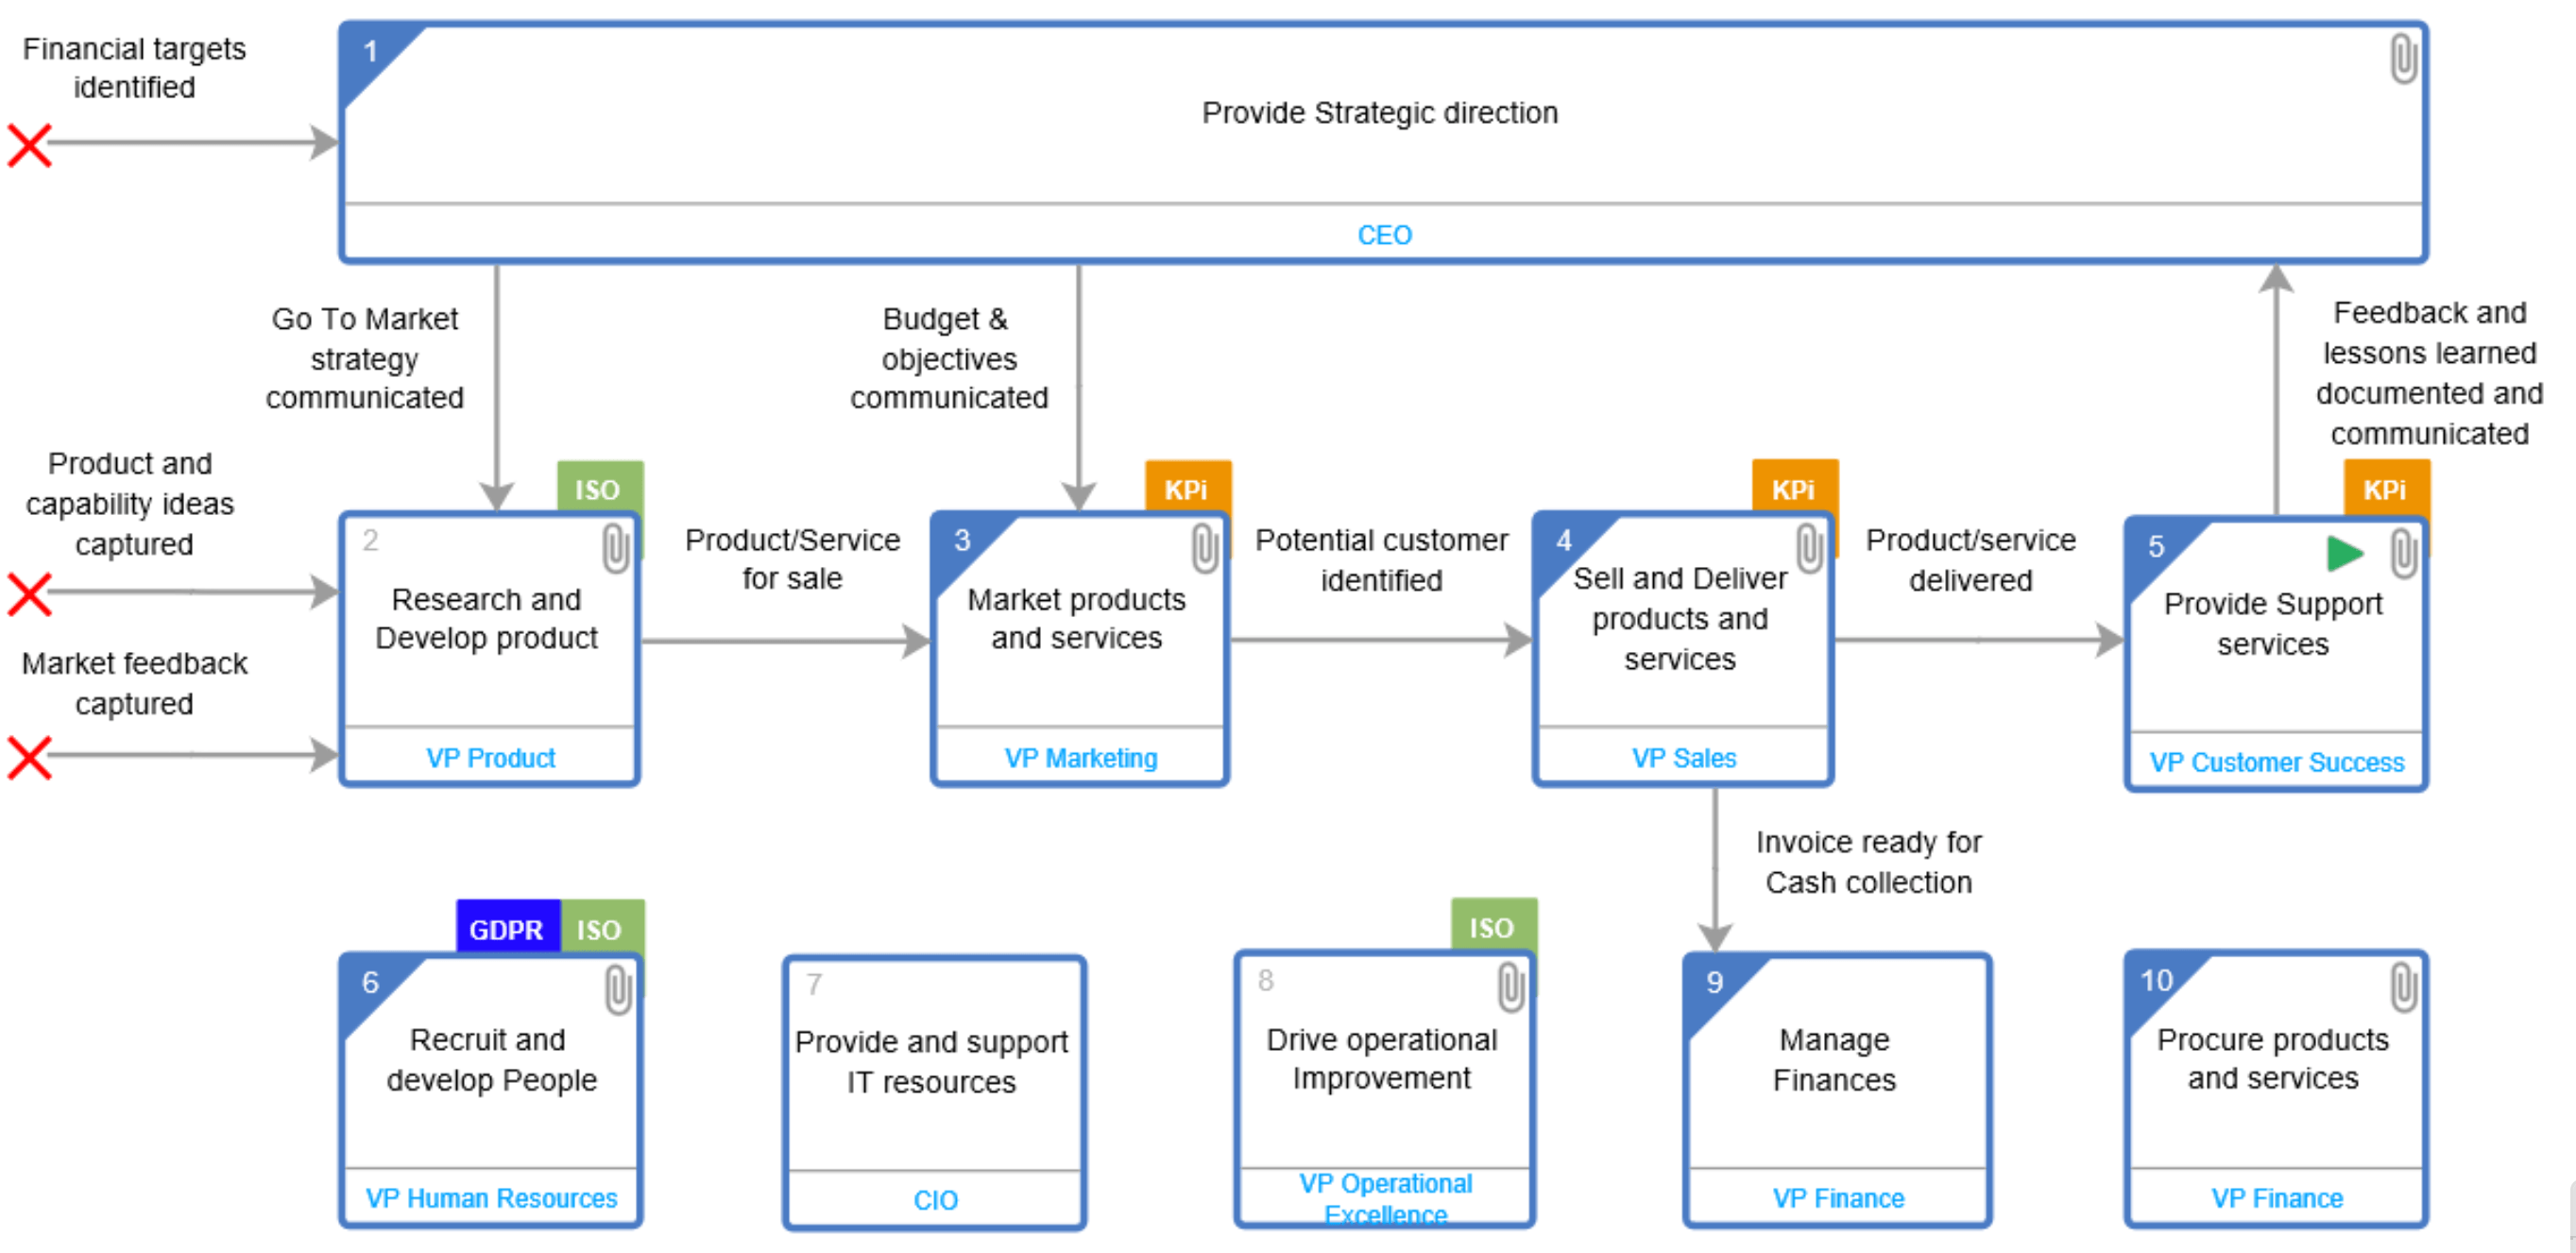
The first milestone is to draw the Top Level of the Company, creating a birds-eye view and a common understanding of the Strategic, Operational and Supporting processes of the organization. A Top Level might look something like this:
Inspired by the APQC model, the Level 1 diagram contains each Process Area in our example company. It also shows the inputs and outputs connecting the different activities, as well as the company role responsible for each activity/Process Area at the bottom of each box.
Users can click on the boxes to drill down to deeper levels of documentation for each process area. How deep you decide to map each process may depend on many things, and there should also be a balance between information shown in the diagrams and what is relayed in attached documents.
Level 2: Process Area Top Levels
After the Company Top Level milestone, the next priority is to draw the Top Levels for the different Process Areas. Depending on your organization, they may be as complex or more complex than the Company Top level, or they can be much simpler. Here is an example of a simpler Top Level of a HR Process Area:
Level 3 and deeper levels
Below the Process Area top levels (Level 2), the organization can go deeper into detail for the Process Activities of each area (down to employee role level) as needed. Here is the drilldown to Box 3 in the example above, Induct new employee:
While it is useful to go over all the areas in the company value chain at least to some degree, the level of detail per process area may depend on many things. The depth of different process areas may also vary greatly depending on the level of commitment from the Process Owners and their staff. But deeper and more complex is not always better!
In some cases, an additional level can be useful to explain an activity better. In other cases, in particular when it comes to more detailed and specific instructions, a simple link attachment can send the user to an instruction file, template, site or a tutorial video that can explain it even better. The point of the map is to deliver process knowledge via simple screens on each level, that are useful to the reader.
In conclusion
It is common to find things out as you go a long with the workshops. A classic example would be: What happens between Sales and Delivery? Do we have a hand-over process?
The answer might surprise you.
After going as deep as you deem necessary for the purposes of the QMS and helping the staff succeed in their individual roles and understand the contexts of their work (and, of course, stay compliant!), the map should be ready for Launch. Post-launch, it is important to keep the Map (and its related content) up-to-date. We will look at different ways to ensure that it is in later posts.
Next up in the series: How to set up your library of Controlled Documents!
If you want to see an example of a process map, please feel free to browse our example map in our Live Demo.
Please feel free to contact us by email or schedule a personal demo if you want to learn more about UPN Processes or implementing a Visual QMS.

